#Rocky Linux 9 + Cockpit
Cockpit에 대한 설명은 IDCHOWTO 앞선 게시글에 나와 있습니다.
👉 [Cockpit 알아보기]
운영체제 버전 업그레이드에 맞춰 Rocky Linux 9에 Cockpit을 설치해보겠습니다.
Cockpit은 간단하게 말씀드리면 웹 UI를 제공하는 서버 자원 관리 도구라고 생각하시면 됩니다.
- Rocky Linux 9에 Cockpit 설치하기
- Cockpit + Grafana 대시보드 보기
<h2>1. Rocky Linux 9 + Cockpit 설치 🥸</h2>
– 패키지 업그레이드
dnf update -y && dnf upgrade -y
– Cockpit 패키지 설치
dnf install -y cockpit
| 다운로드 패키지 목록 |
|
Last metadata expiration check: 0:03:32 ago on Wed Apr 2 13:53:40 2025.
Dependencies resolved.
====================================================================================================================
Package Architecture Version Repository Size
====================================================================================================================
Installing:
cockpit x86_64 323.1-1.el9_5 baseos 41 k
Installing dependencies:
clevis x86_64 20-200.el9 appstream 54 k
cryptsetup x86_64 2.7.2-3.el9_5 baseos 310 k
device-mapper-event x86_64 9:1.02.198-2.el9 baseos 34 k
device-mapper-event-libs x86_64 9:1.02.198-2.el9 baseos 31 k
device-mapper-multipath-libs x86_64 0.8.7-32.el9 baseos 271 k
device-mapper-persistent-data x86_64 1.0.9-3.el9_4 baseos 1.0 M
iscsi-initiator-utils x86_64 6.2.1.9-1.gita65a472.el9 baseos 383 k
iscsi-initiator-utils-iscsiuio x86_64 6.2.1.9-1.gita65a472.el9 baseos 80 k
isns-utils-libs x86_64 0.101-4.el9 baseos 100 k
jose x86_64 14-1.el9 appstream 66 k
libaio x86_64 0.3.111-13.el9 baseos 23 k
libblockdev-lvm x86_64 2.28-10.el9 appstream 35 k
libjose x86_64 14-1.el9 appstream 63 k
libluksmeta x86_64 9-12.el9 appstream 25 k
luksmeta x86_64 9-12.el9 appstream 21 k
lvm2 x86_64 9:2.03.24-2.el9 baseos 1.5 M
lvm2-libs x86_64 9:2.03.24-2.el9 baseos 1.0 M
python3-psutil x86_64 5.8.0-12.el9 appstream 205 k
tpm2-tools x86_64 5.2-4.el9 baseos 736 k
tracer-common noarch 1.1-2.el9 appstream 22 k
Installing weak dependencies:
clevis-luks x86_64 20-200.el9 appstream 34 k
cockpit-packagekit noarch 323.1-1.el9_5 appstream 845 k
cockpit-storaged noarch 323.1-1.el9_5 appstream 789 k
device-mapper-multipath x86_64 0.8.7-32.el9 baseos 146 k
python3-tracer noarch 1.1-2.el9 appstream 111 k
udisks2-iscsi x86_64 2.9.4-11.el9 appstream 26 k
udisks2-lvm2 x86_64 2.9.4-11.el9 appstream 42 k
Transaction Summary
====================================================================================================================
Install 28 Packages
|
– Cockpit 서비스 실행
systemctl enable cockpit.socket --now
소켓 기반으로 실행되기 때문에 위와 같이 서비스 명을 소켓으로 맞춰 줍니다.
방화벽 사용 중이라면 TCP 9090 포트를 등록합니다.
http://<서버IP>:9090 접속 시 아래와 같이 로그인 창이 출력됩니다.
| cockpit 초기 접속화면 |
|

|
– 사용할 계정 생성 후 로그인
wheel 그룹에 속한 user를 생성해줍니다.
useradd -m -G wheel cockpituser && passwd cockpituser
| 생성 계정 정보 확인 |
|
[root@cockpit ~]# id cockpituser
uid=1001(cockpituser) gid=1001(cockpituser) groups=1001(cockpituser),10(wheel)
[root@cockpit ~]# groups cockpituser
cockpituser : cockpituser wheel
|
위 정보로 로그인 시 아래와 같이 기본 화면이 출력됩니다.
| cockpit 로그인 후 화면 |
|

|
위 파란색 박스를 누르고 cockpituser의 비밀번호를 한 번 더 입력하면 admin 권한으로 변경됩니다.
※ Cockpit에 대해 더 궁금한 점이 있다면 아래 공식 사이트를 참고 바랍니다.
📚 [공식 사이트 이동하기]
<h2>2. Cockpit + Grafana 대시보드 보기 🥸</h2>
Cockpit Plugin을 계속 찾아봤지만 Noti 관련 Plugin은 딱히 보이지 않았습니다.
Grafana 연동 시 해당 값을 이용하여 쿼리를 생성하려면 알림에 사용 가능한 다른 데이터 소스를 사용해야 합니다.
(찾으신 다른 분이 있다면 댓글로 공유 부탁드립니다.)
– Grafana 설치
| Grafana 설치 과정 요약 |
|
# rpm 패키지 추가 후 설치
👉 [패키지 버전 확인하기]
cd /usr/local/src
wget https://dl.grafana.com/enterprise/release/grafana-enterprise-11.6.0-1.x86_64.rpm
dnf install -y grafana-enterprise-11.6.0-1.x86_64.rpm
# grafana-server 서비스 실행
systemctl enable grafana-server –now
===
Created symlink /etc/systemd/system/multi-user.target.wants/grafana-server.service → /usr/lib/systemd/system/grafana-server.service.
===
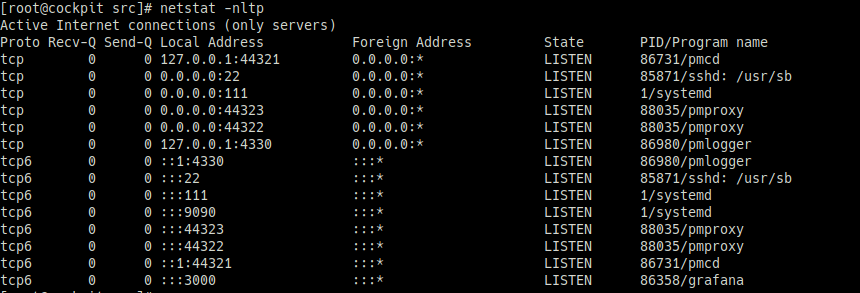
netstat -nltp
===
Active Internet connections (only servers)
Proto Recv-Q Send-Q Local Address Foreign Address State PID/Program name
tcp 0 0 0.0.0.0:22 0.0.0.0:* LISTEN 85871/sshd: /usr/sb
tcp 0 0 0.0.0.0:111 0.0.0.0:* LISTEN 1/systemd
tcp6 0 0 :::22 :::* LISTEN 85871/sshd: /usr/sb
tcp6 0 0 :::111 :::* LISTEN 1/systemd
tcp6 0 0 :::9090 :::* LISTEN 1/systemd
tcp6 0 0 :::3000 :::* LISTEN 86358/grafana
===
# 방화벽을 사용한다면 마찬가지로 TCP 3000번을 추가합니다.
# 브라우저에서 http://<서버IP>:3000 접속 후 비밀번호를 변경합니다. 초기 계정과 비밀번호 모두 admin 입니다.
# Grafana PCP plugin 설치
📚 [Grafana PCP plugin 소개]
📜 [수동 설치 방법 Docu]
👉 [Grafana PCP Github]
grafana-cli plugins install performancecopilot-pcp-app
systemctl restart grafana-server
# 웹 UI에서 설치한 Plugin 허용
[Administration – Plugins and data – Plugins – Performance Co-Pilot 검색 후 선택 – Enable 처리]

|
– Cockpit PCP(Performance Co-Pilot) Plugin 설치
dnf install -y cockpit-pcp pcp pcp-export-pcp2json
관련 서비스들을 실행시켜 줍니다.
systemctl enable pmcd pmlogger pmproxy --now
| cockpit pcp 활성화 데몬 목록 |
|
|
– Grafana에 데이터 연동
| [Connections – Data sources – Add data source] |
|

|
[PCP 검색 – PCP Vector 클릭] |
|
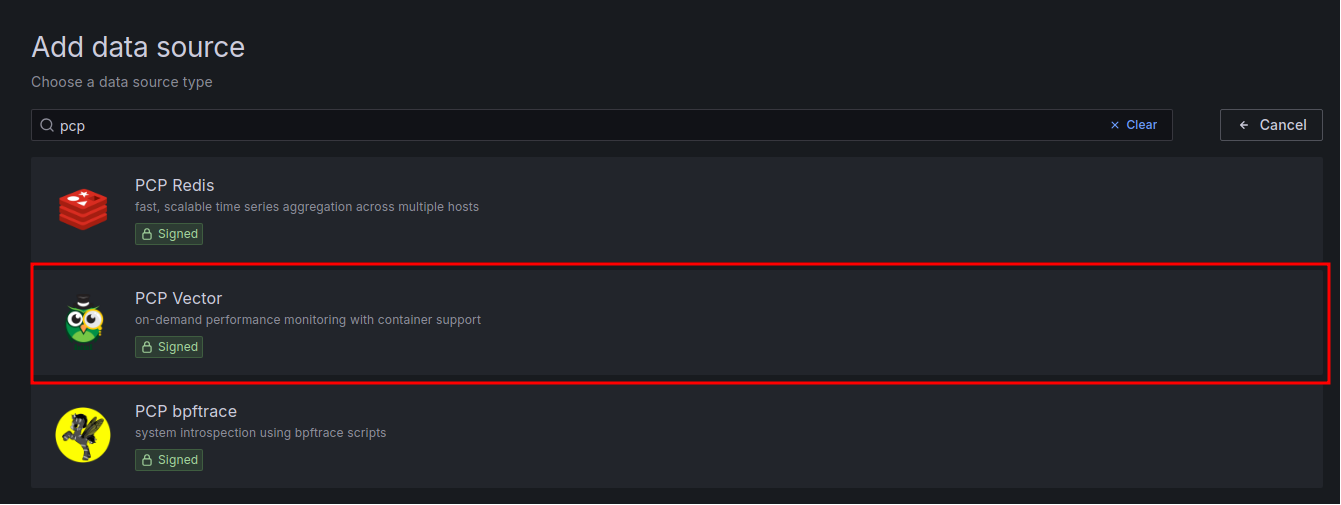
|
| [Name과 URL 입력] |
 |
데이터 working이 잘 되는지 확인합니다.
| Dashboard Data 출력 확인 |
|
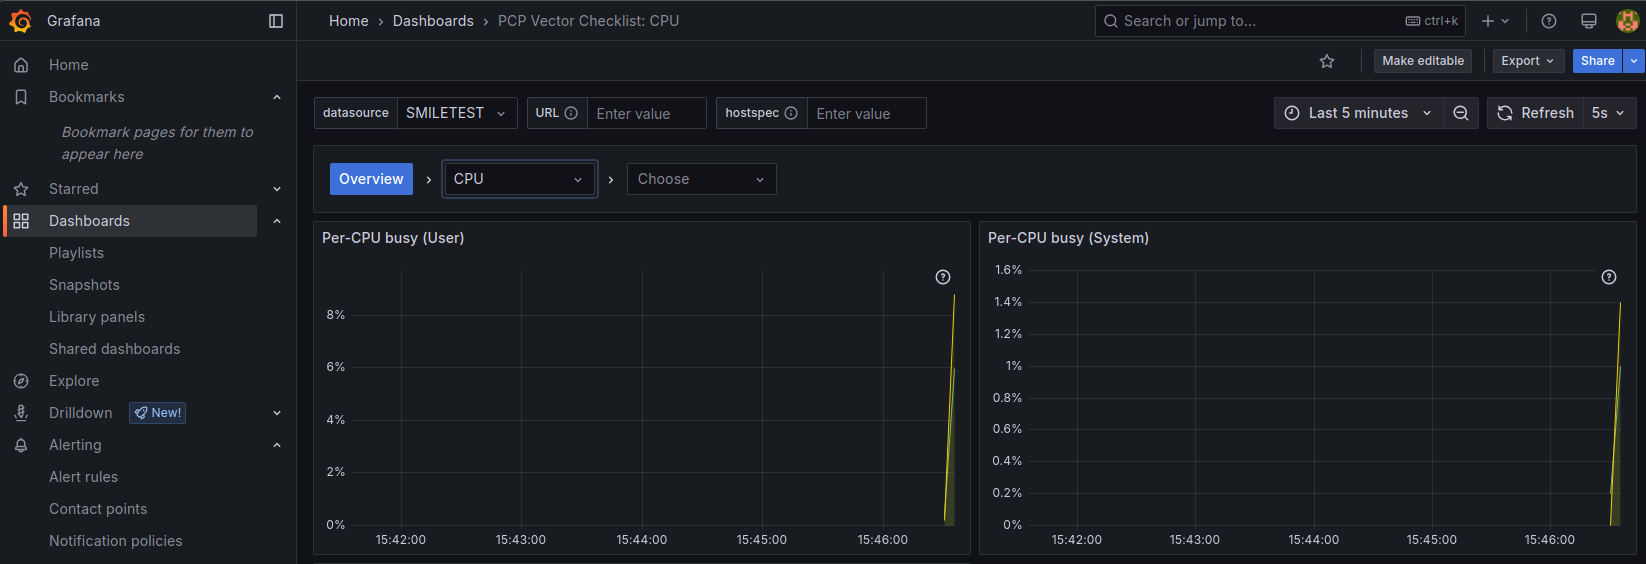
|
Cockpit 자체도 대시보드가 잘 구성되어 있지만, 연동하여 사용하면 더 많은 방면으로 활용이 가능합니다.
감사합니다.