


Loki 로그 모니터링
Grafana, Loki, Promtail로 Ubuntu 22.04에 로그 모니터링 환경 구축하기
시스템 로그를 효율적으로 수집하고 시각화하는 것은 서버 운영에서 매우 중요합니다. 이번 포스팅에서는 Grafana, Loki, Promtail의 개념을 간단히 소개하고, Ubuntu 22.04 환경에서 이들을 연동하여 로그 모니터링 시스템을 구축하는 과정을 정리해보겠습니다.
1. 각 컴포넌트의 역할
Grafana란?
Grafana는 다양한 데이터 소스를 시각화할 수 있는 오픈소스 대시보드 플랫폼입니다. Loki와 연동하면 로그 데이터를 실시간으로 탐색하고, 대시보드 형태로 시각화할 수 있습니다.
Loki란?
Loki는 Grafana Labs에서 개발한 로그 집계 및 저장 시스템입니다. Prometheus와 유사한 구조로, 로그를 효율적으로 저장하고 LogQL이라는 쿼리 언어로 로그를 검색할 수 있습니다.
Promtail이란?
Promtail은 로그 수집 에이전트입니다. 서버의 로그 파일을 실시간으로 감시하여 새로운 로그가 발생하면 이를 Loki로 전송합니다. 로그에 라벨을 붙여서 Loki에서 효율적으로 검색할 수 있게 해줍니다.
2. 설치 및 연동 순서 (Ubuntu 22.04 기준)
1) Grafana 설치
GPG 키 등록 및 저장소 추가
wget -q -O - https://packages.grafana.com/gpg.key | sudo apt-key add -
add-apt-repository "deb https://packages.grafana.com/oss/deb stable main" apt update

Grafana 설치 및 서비스 시작

apt install grafana
systemctl start grafana-server
systemctl enable grafana-server
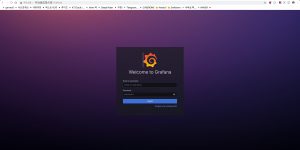
웹 UI 접속
브라우저에서 http://<서버IP>:3000 접속 후 로그인 (기본 계정: admin/admin, 최초 로그인 시 비밀번호 변경).
2) Loki 설치
Loki 바이너리 다운로드 및 설치
curl -LO "https://github.com/grafana/loki/releases/latest/download/loki-linux-amd64.zip"
unzip loki-linux-amd64.zip
mv loki-linux-amd64 /usr/local/bin/loki
chmod +x /usr/local/bin/loki

설정 파일 준비

wget -O /etc/loki-local-config.yaml https://raw.githubusercontent.com/grafana/loki/main/cmd/loki/loki-local-config.yaml

systemd 서비스 등록

sudo tee /etc/systemd/system/loki.service > /dev/null <<EOF
[Unit]
Description=Loki service
After=network.target

[Service] Type=simple
ExecStart=/usr/local/bin/loki -config.file=/etc/loki-local-config.yaml Restart=on-failure

[Install] WantedBy=multi-user.target
EOF

systemctl daemon-reload
systemctl start loki
systemctl enable loki
systemctl status loki

Loki는 기본적으로 3100 포트에서 동작하며, 웹 UI는 없고 API만 제공합니다.
![]()
3) Promtail 설치 및 구성
Promtail 바이너리 다운로드 및 설치
curl -LO "https://github.com/grafana/loki/releases/latest/download/promtail-linux-amd64.zip"
unzip promtail-linux-amd64.zip
mv promtail-linux-amd64 /usr/local/bin/promtail
chmod +x /usr/local/bin/promtail

설정 파일 작성

/etc/promtail-local-config.yaml 예시:
text
server:
 http_listen_port: 9080
 grpc_listen_port: 0

positions:
 filename: /var/lib/promtail/positions.yaml

clients:
 - url: http://localhost:3100/loki/api/v1/push

scrape_configs:
 - job_name: system
   static_configs:
     - targets: ['localhost']
       labels:
        job: varlogs
        path: /var/log/*.log

systemd 서비스 등록

tee /etc/systemd/system/promtail.service > /dev/null <<EOF

[Unit]
Description=Promtail service
After=network.target

[Service]
Type=simple
ExecStart=/usr/local/bin/promtail -config.file=/etc/promtail-local-config.yaml
Restart=on-failure

[Install] WantedBy=multi-user.target
EOF

systemctl daemon-reload
systemctl start promtail
systemctl enable promtail
systemctl status promtail

Promtail은 /var/log/*.log 경로의 로그 파일을 감시하고, 새로운 로그가 추가될 때마다 Loki로 전송합니다.
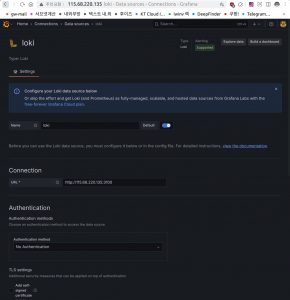
4) Grafana에서 Loki 데이터 소스 등록
Grafana 웹 UI 접속 후,
[Connections] → [Data sources] → [Add data source] → Loki 선택
URL 입력: http://localhost:3100
Save & Test 클릭하여 연결 확인
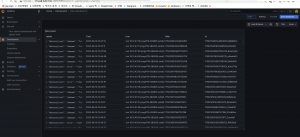
5) 로그 쿼리 및 시각화
Explore 메뉴에서 {job=”varlogs”} 등 LogQL 쿼리를 입력해 로그를 실시간으로 탐색할 수 있습니다.
대시보드에 로그 패널을 추가하여 로그를 시각화할 수 있습니다.
마무리
Promtail, Loki, Grafana를 연동하면 시스템 로그를 쉽고 직관적으로 모니터링할 수 있습니다. 각 단계에서 설정 파일의 경로, 포트, 라벨 등은 환경에 맞게 조정해야 하며, 서비스가 정상 동작하지 않을 땐 로그와 설정 파일을 꼼꼼히 점검하세요.
참조
https://growupcoding.tistory.com/122
https://dgjinsu.tistory.com/60