


Docker 를 활용한 Grafana 서비스 구축 및 Prometheus 연동
사용 서버 : CentOS 7 OS Server 1대(115.68.249.67)
난이도 : ★★
내용 요약 : Docker 활용 Grafana 구축 및 Prometheus 연동
참고 링크 :
https://www.44bits.io/ko/keyword/grafana
https://gurumee92.tistory.com/224
목차 :
01. Grafana? Prometheus?
02. Docker 설치 및 기본 구축
03. Grafana, Prometheus 구축
04. 연동 및 구축 확인
01. Grafana? Prometheus?
> Grafana:
▷ 역할:
Grafana는 오픈 소스 데이터 시각화 및 모니터링 도구로, 다양한 데이터 소스에서 메트릭을 시각화하고 대시보드를 구성할 수 있습니다.
▷ 주요 기능:
- 다양한 데이터 소스 : Grafana는 Prometheus, InfluxDB, Elasticsearch 등 다양한 데이터 소스와 통합하여 데이터를 시각화할 수 있습니다.
- 대시보드 : 사용자 정의 대시보드를 생성하여 여러 데이터 소스에서 메트릭을 시각화하고 모니터링할 수 있습니다.
- 다양한 시각화 옵션 : Grafana는 그래프, 테이블, 패널 등 다양한 시각화 옵션을 제공하여 데이터를 쉽게 이해할 수 있도록 돕습니다.
- 경고 및 알림 : Grafana는 경고 규칙을 설정하고 경고 조건이 충족될 때 알림을 생성할 수 있는 기능을 제공합니다.
- 사용자 관리 및 권한 설정 : Grafana는 사용자 및 팀을 관리하고 대시보드에 대한 액세스 권한을 설정할 수 있는 기능을 제공합니다.
> Prometheus:
▷ 역할:
Prometheus는 오픈 소스 시계열 데이터베이스 및 모니터링 시스템입니다.
시스템 및 서비스의 성능 지표를 수집하고 저장하여 실시간 모니터링 및 경고 기능을 제공합니다.
▷ 주요 기능:
- 다차원 데이터 모델 : Prometheus는 시계열 데이터를 메트릭으로 저장하며, 이러한 메트릭은 다차원 레이블로 식별됩니다.
- PromQL 쿼리 언어 : Prometheus는 PromQL이라는 강력한 쿼리 언어를 제공하여 메트릭을 쿼리하고 집계하는 기능을 제공합니다.
- 내장된 시각화 : Prometheus는 내장된 시각화 기능을 제공하지 않지만, Grafana와 연동하여 시각화할 수 있습니다.
- 서비스 디스커버리 : 서비스 디스커버리를 통해 새로운 서비스를 자동으로 탐지하고 모니터링할 수 있습니다.
- 경고 및 알림 : Prometheus는 특정 조건이나 임계값을 초과할 때 경고를 생성하고 알림을 보낼 수 있는 기능을 제공합니다
요약하면, Prometheus는 시계열 데이터를 수집하고 저장하는 모니터링 시스템이며, Grafana는 수집된 데이터를 시각화하고 모니터링하는 대시보드 도구입니다.
이 두 도구를 함께 사용하면 시스템 및 서비스의 성능을 실시간으로 모니터링하고 이해할 수 있습니다.
02. Docker 설치 및 기본 구축
01. Docker 설치
# Docker 설치 스크립트 다운로드 및 실행
curl -fsSL https://get.docker.com -o get-docker.sh
sudo sh get-docker.sh

# Docker 서비스 시작 및 부팅 시 자동 실행 설정
sudo systemctl start docker
sudo systemctl enable docker

# 현재 사용자를 Docker 그룹에 추가하여 root 권한 없이 Docker 명령을 실행할 수 있도록 설정
sudo usermod -aG docker $USER
02. Docker compose 설치
sudo curl -L "https://github.com/docker/compose/releases/download/1.29.2/docker-compose-$(uname -s)-$(uname -m)" -o /usr/local/bin/docker-compose

sudo chmod +x /usr/local/bin/docker-compose
03. 설치 및 구동 확인
[root@minhyuk_test ~]# systemctl status docker
● docker.service - Docker Application Container Engine
   Loaded: loaded (/usr/lib/systemd/system/docker.service; enabled; vendor preset: disabled)
   Active: active (running) since 일 2024-02-25 05:01:46 KST; 58min ago
     Docs: https://docs.docker.com
 Main PID: 28552 (dockerd)
   CGroup: /system.slice/docker.service
           ├─28552 /usr/bin/dockerd -H fd:// --containerd=/run/containerd/containerd.sock
           ├─30391 /usr/bin/docker-proxy -proto tcp -host-ip 0.0.0.0 -host-port 3000 -container-ip 172.18.0.3 -c...
           └─30396 /usr/bin/docker-proxy -proto tcp -host-ip :: -host-port 3000 -container-ip 172.18.0.3 -contai...

 2월 25 05:49:52 minhyuk_test dockerd[28552]: time="2024-02-25T05:49:52.353398630+09:00" level=info msg="ig...ete"
 2월 25 05:50:52 minhyuk_test dockerd[28552]: time="2024-02-25T05:50:52.901288063+09:00" level=info msg="ig...ete"
 2월 25 05:51:53 minhyuk_test dockerd[28552]: time="2024-02-25T05:51:53.479022961+09:00" level=info msg="ig...ete"
 2월 25 05:52:54 minhyuk_test dockerd[28552]: time="2024-02-25T05:52:54.033470508+09:00" level=info msg="ig...ete"
 2월 25 05:53:54 minhyuk_test dockerd[28552]: time="2024-02-25T05:53:54.585685899+09:00" level=info msg="ig...ete"
 2월 25 05:54:55 minhyuk_test dockerd[28552]: time="2024-02-25T05:54:55.114844771+09:00" level=info msg="ig...ete"
 2월 25 05:55:55 minhyuk_test dockerd[28552]: time="2024-02-25T05:55:55.656564315+09:00" level=info msg="ig...ete"
 2월 25 05:56:56 minhyuk_test dockerd[28552]: time="2024-02-25T05:56:56.196637729+09:00" level=info msg="ig...ete"
 2월 25 05:57:56 minhyuk_test dockerd[28552]: time="2024-02-25T05:57:56.731378192+09:00" level=info msg="ig...ete"
 2월 25 05:58:57 minhyuk_test dockerd[28552]: time="2024-02-25T05:58:57.280120105+09:00" level=info msg="ig...ete"
03. Grafana, Prometheus 구축
01. docker-compose.yml 파일 생성
version: '3'

services:
  grafana:
    image: grafana/grafana
    container_name: grafana
    ports:
      - "3000:3000"
    restart: always

  prometheus:
    image: prom/prometheus
    container_name: prometheus
    ports:
      - "9090:9090"
    volumes:
      - ./prometheus:/etc/prometheus
    command:
      - '--config.file=/etc/prometheus/prometheus.yml'
    restart: always
02. prometheus.yml 파일 생성
global:
  scrape_interval:     15s
  evaluation_interval: 15s

scrape_configs:
  - job_name: 'prometheus'
    static_configs:
      - targets: ['localhost:9090']

  - job_name: 'node'
    static_configs:
      - targets: ['115.68.249.67:9100']  # 구축 서버의 IP 주소와 Prometheus Exporter의 포트 번호
03. yaml 파일 실행 및 서비스 구축
[root@minhyuk_test src]# docker-compose up -d
Pulling grafana (grafana/grafana:)...
latest: Pulling from grafana/grafana
96526aa774ef: Pull complete
af869e9f581d: Pull complete
c828b90987c8: Pull complete
6a44c336bed2: Pull complete
d73b69637599: Pull complete
4fb23724bd56: Pull complete
0a6be8a05967: Pull complete
2d404d8d5de1: Pull complete
5849c29f9be2: Pull complete
5ca294d0961f: Pull complete
Digest: sha256:8640e5038e83ca4554ed56b9d76375158bcd51580238c6f5d8adaf3f20dd5379
Status: Downloaded newer image for grafana/grafana:latest
Pulling prometheus (prom/prometheus:)...
latest: Pulling from prom/prometheus
9fa9226be034: Pull complete
1617e25568b2: Pull complete
6f4a80003cf9: Pull complete
51cfadd26766: Pull complete
e3de990d5ffd: Pull complete
1afd2f7a865c: Pull complete
7fd6d3a006a1: Pull complete
6a9cc026e75a: Pull complete
6781534f4f1c: Pull complete
a312dd93cbc2: Pull complete
5d187378349f: Pull complete
1656ce9fb282: Pull complete
Digest: sha256:042258e3578a558ce41b036104dfa997b2d25151ab6889a3f4d6187e27b1176c
Status: Downloaded newer image for prom/prometheus:latest
Creating prometheus ... done
Creating grafana    ... done

[root@minhyuk_test src]# docker compose ps -a
NAME         IMAGE             COMMAND                   SERVICE      CREATED          STATUS                         PORTS
grafana      grafana/grafana   "/run.sh"                 grafana      42 seconds ago   Up 18 seconds                  0.0.0.0:3000->3000/tcp, :::3000->3000/tcp
prometheus   prom/prometheus   "/bin/prometheus --c…"   prometheus   42 seconds ago   Restarting (2) 4 seconds ago
[root@minhyuk_test src]# netstat -ntlp
Active Internet connections (only servers)
Proto Recv-Q Send-Q Local Address           Foreign Address         State       PID/Program name
tcp        0      0 0.0.0.0:22              0.0.0.0:*               LISTEN      22409/sshd
tcp        0      0 0.0.0.0:3000            0.0.0.0:*               LISTEN      11396/docker-proxy
tcp        0      0 127.0.0.1:25            0.0.0.0:*               LISTEN      984/master
tcp6       0      0 :::22                   :::*                    LISTEN      22409/sshd
tcp6       0      0 :::3000                 :::*                    LISTEN      11402/docker-proxy
tcp6       0      0 ::1:25                  :::*                    LISTEN      984/master
yaml 파일에서 Grafana 서비스는 3,000번포트, Prometheus 서비스는 9090번 포트로 설정하였으나,
서로 연동될 때는 각 서비스가 자신의 컨테이너 내부에 노출된 포트를 사용하여 통신합니다.
즉, Grafana 서비스에서 Prometheus와 연동되더라도, 실제로 연결되는 것은 Grafana 서비스의 컨테이너 내부에 노출된 Prometheus의 9090번 포트입니다.
이러한 내부 통신은 Docker 네트워킹을 통해 이루어지며, 외부 통신에 있어서는 Grafana 서비스의 3000번 포트만을 통해 접속할 수 있습니다.
04. 연동 및 구축 확인
▶ Grafana 웹서비스 접근 URL : http://Server IP:Port Num ( http://115.68.249.67:3000 )
-> 초기 접속정보 ( admin / admin )
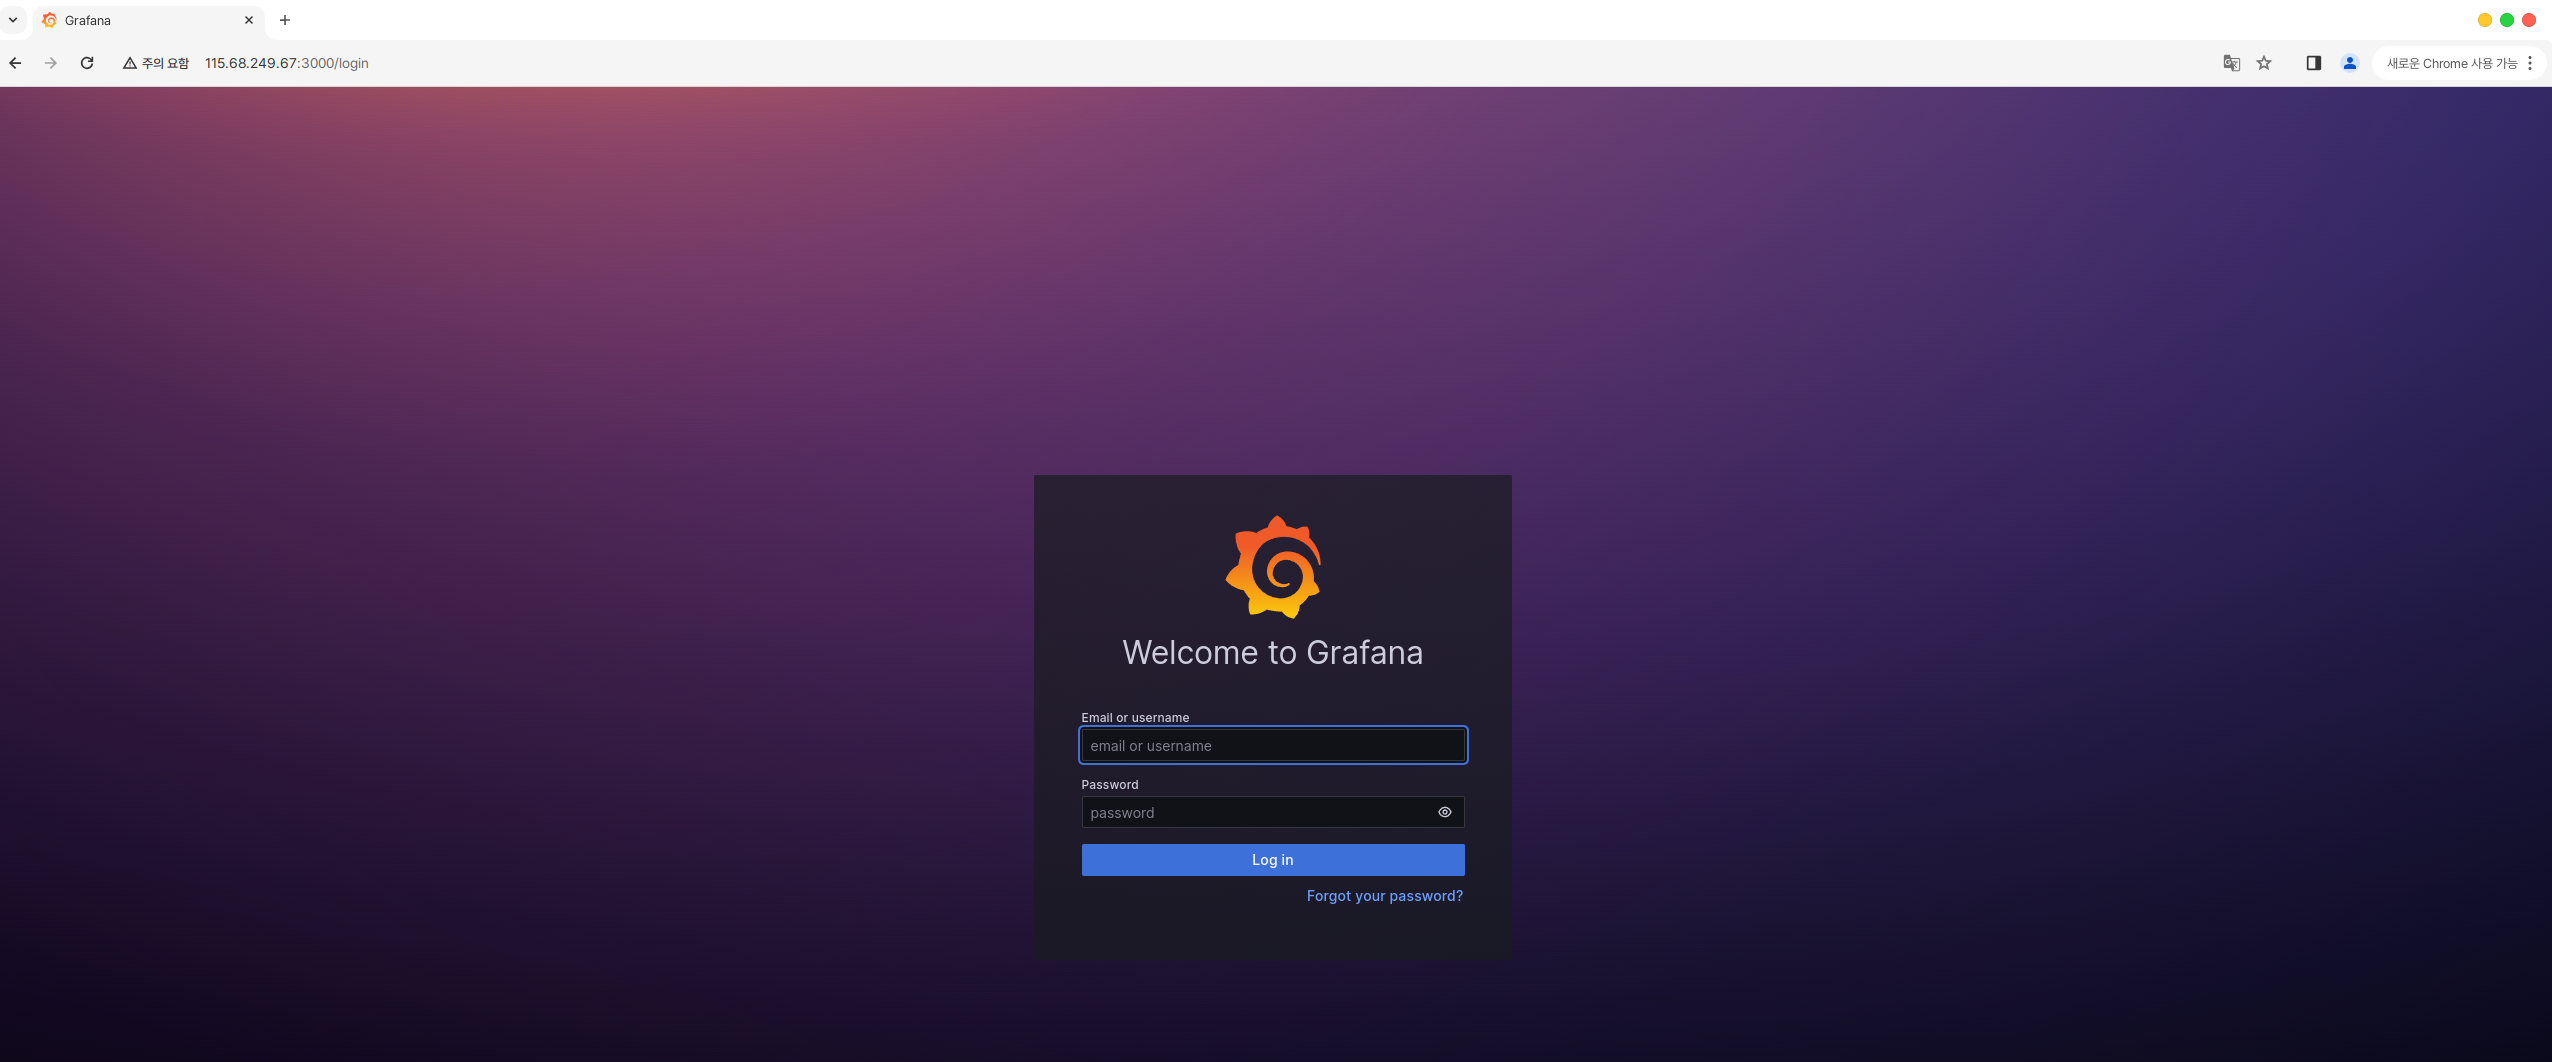
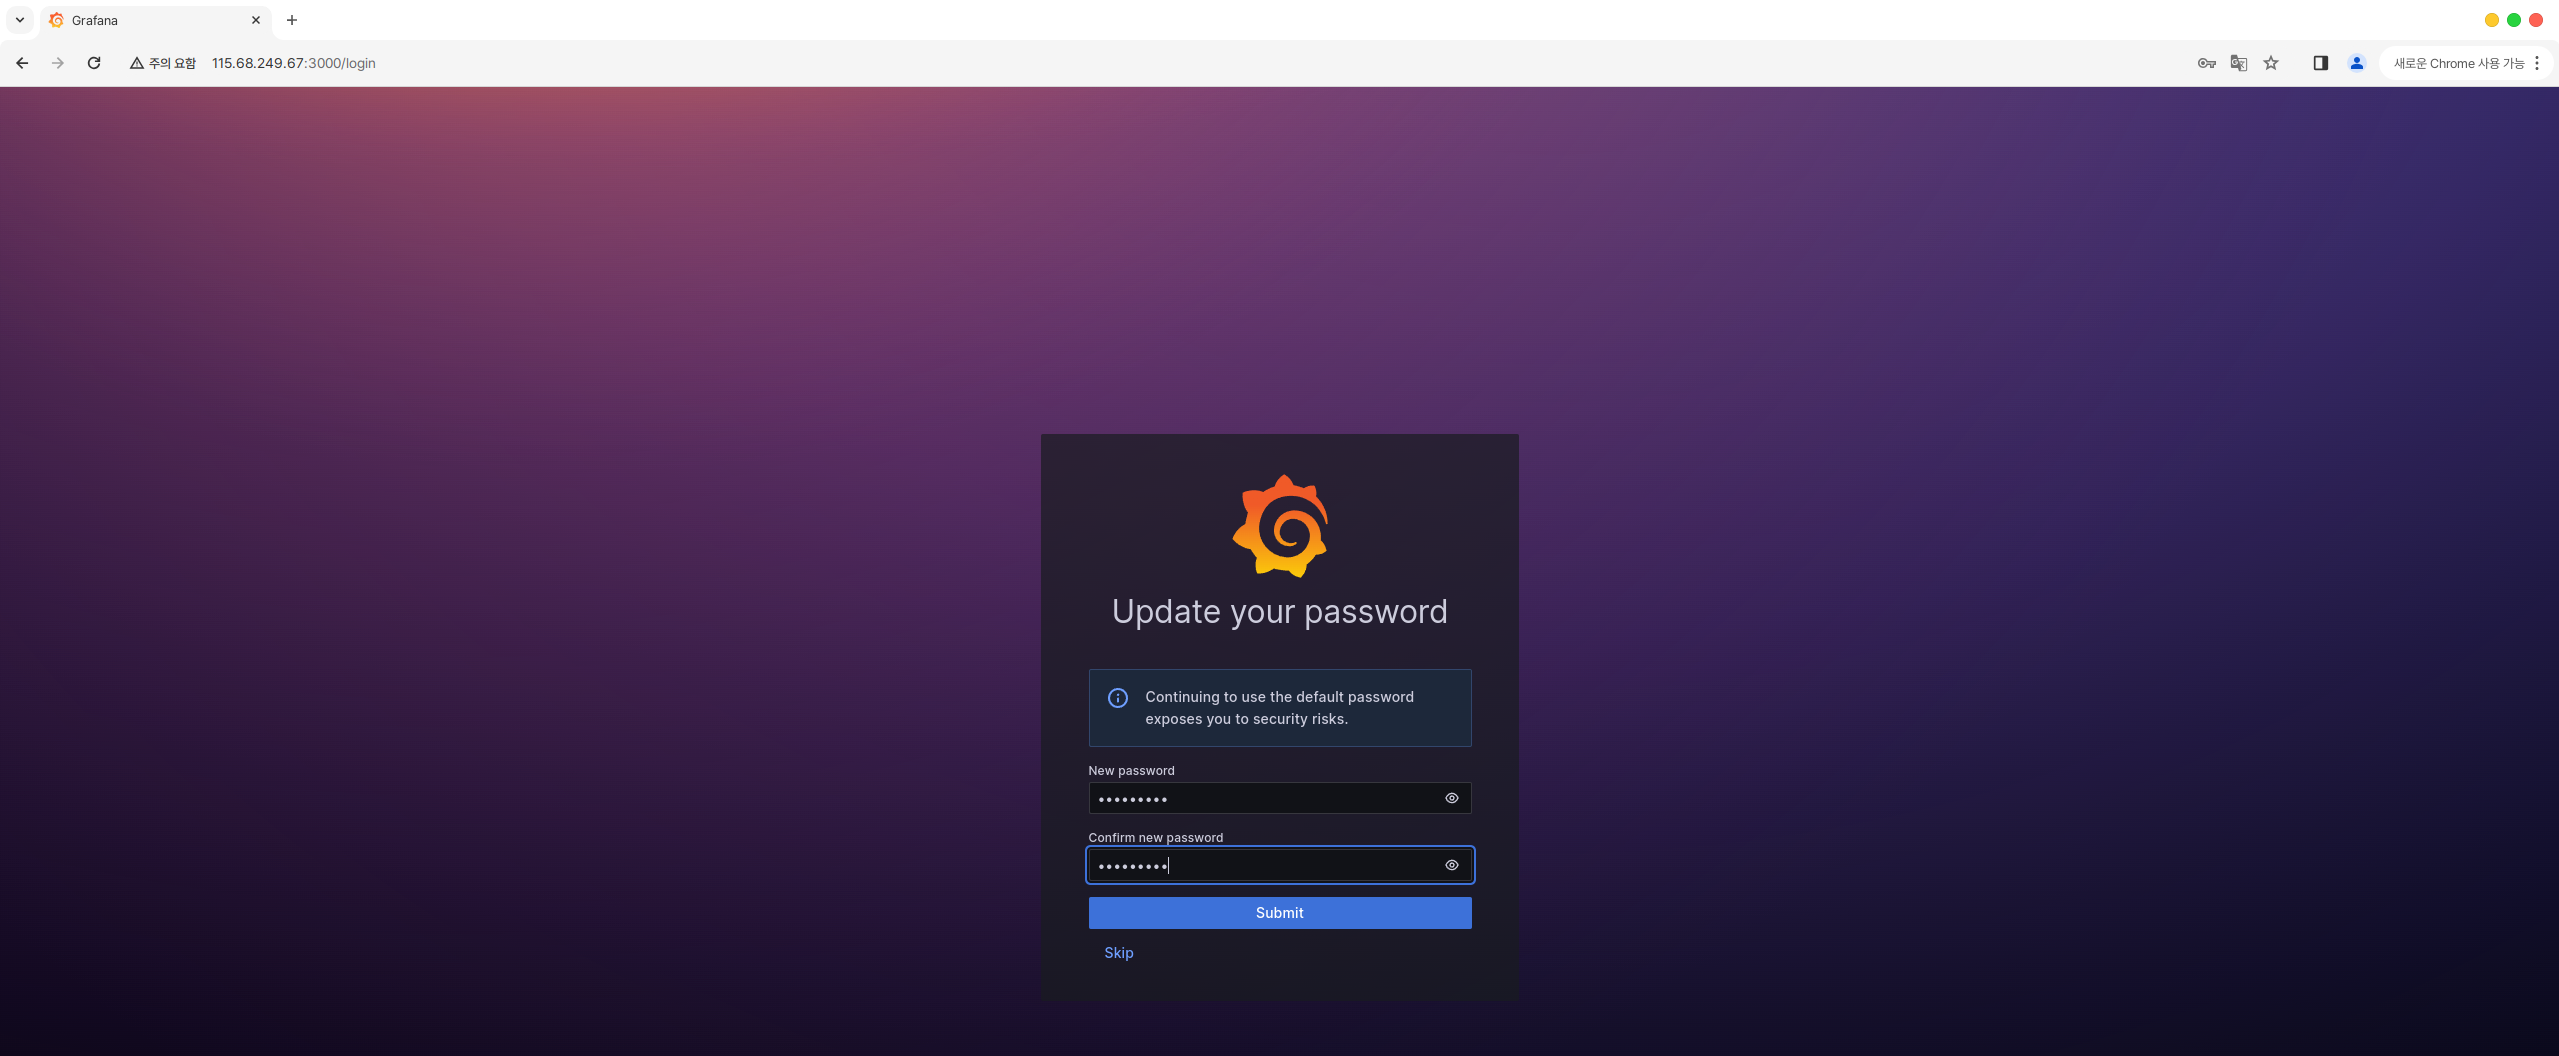
서비스 구축 후 첫 로그인 시에 보안을 위하여 개인 비밀번호로 변경하는 점을 추천합니다.
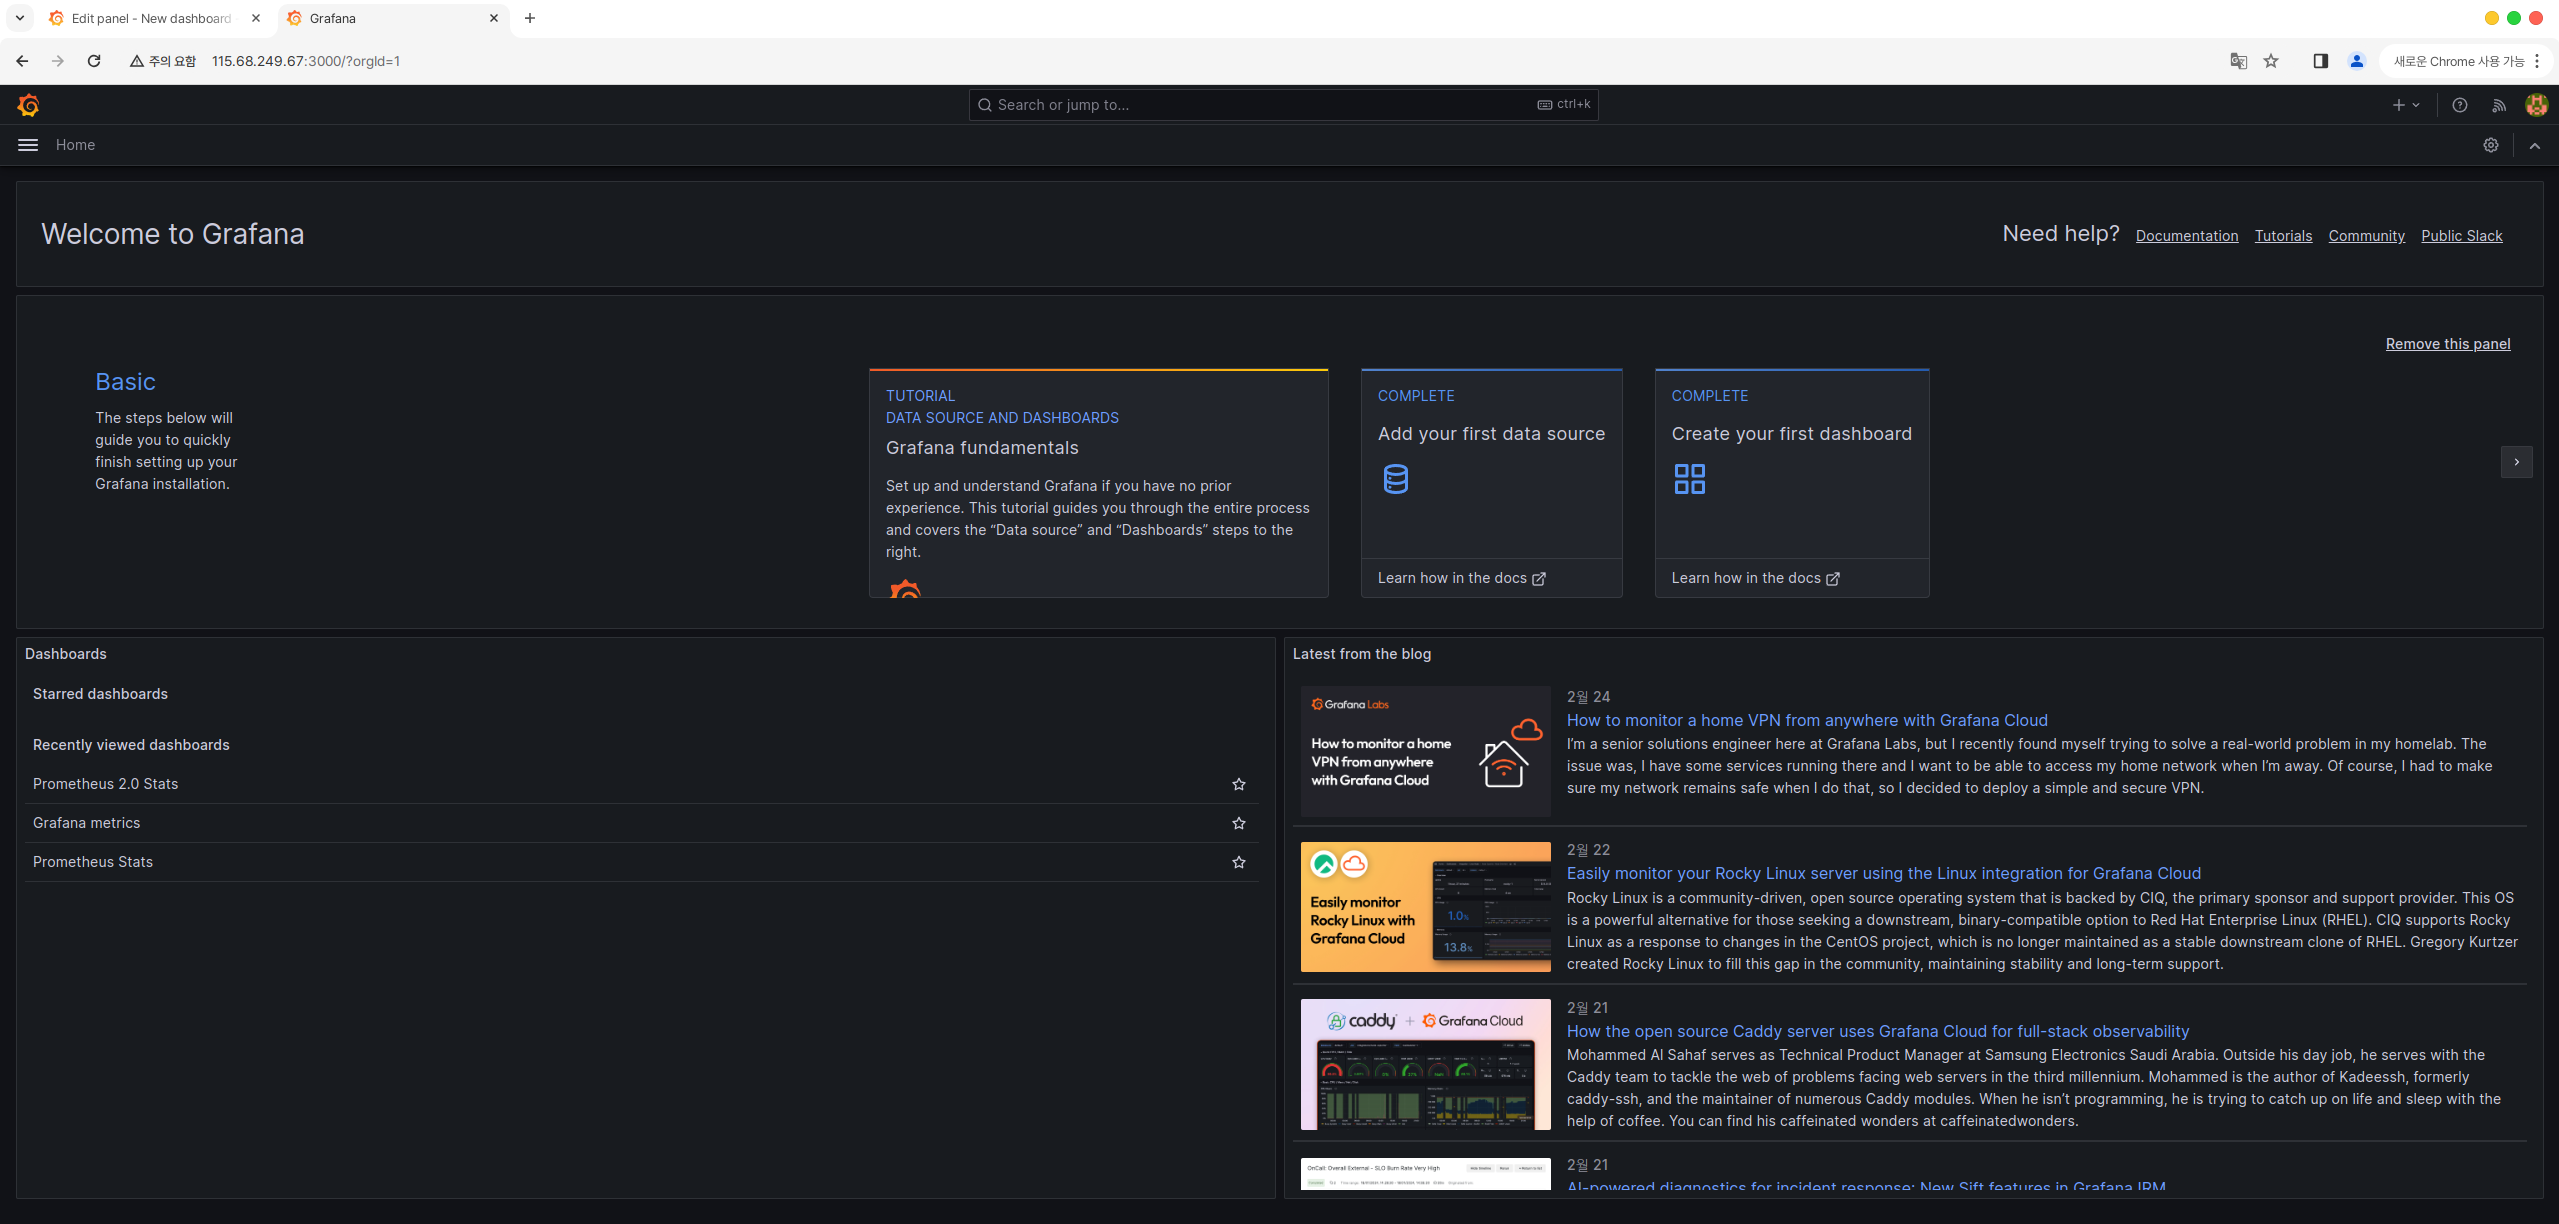
첫 진입 시 확인되는 홈화면입니다.
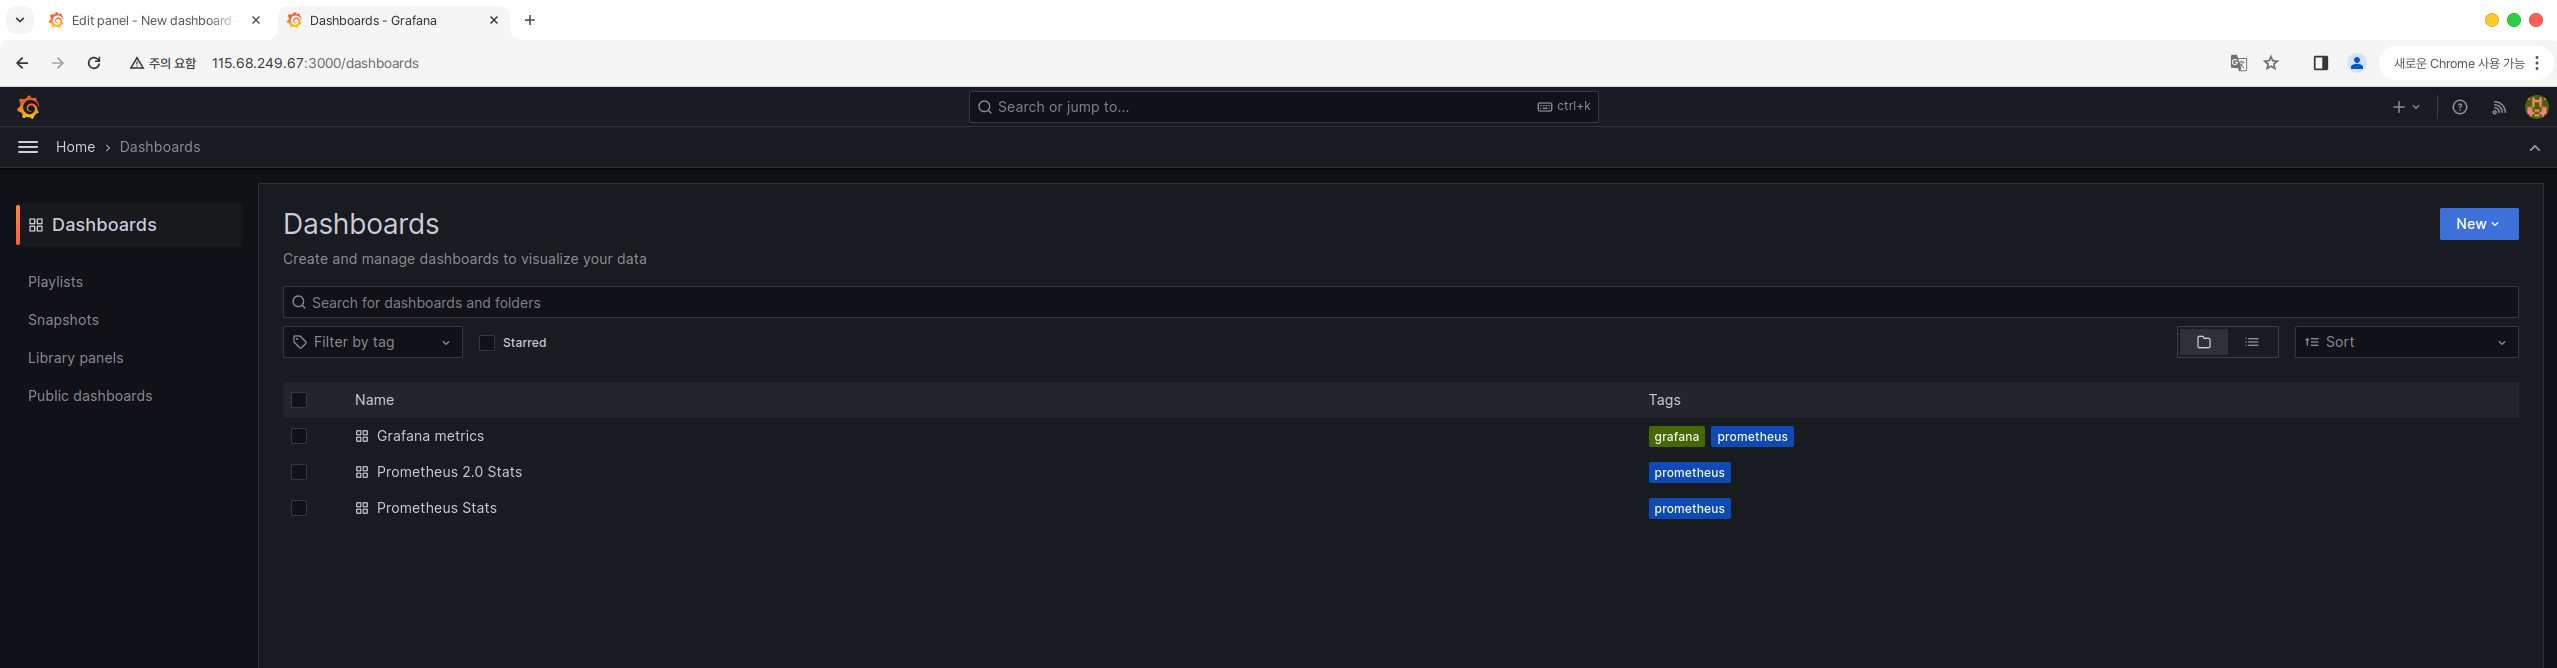
대시보드에 진입하여 Prometheus Dashboard를 import 하였습니다.
Prometheus 뿐만 아니라 수많은 서비스들을 제공하고 있으며 서비스 구축에 난이도가 크게 높지 않아 활용도가 높은 점을 장점으로 들 수 있을것같습니다.
이상으로 Docker를 활용하여 Grafana 설치 및 Prometheus 연동 및 구축을 마무리하겠습니다.
감사합니다.